Global institutional investors’ carbon exposure increased significantly over the past year, with investors’ increased exposure to carbon-intensive sectors and a year-over-year increase in corporate emissions, even as carbon intensity, as measured by emissions per unit of portfolio company revenue, declined by double digits, according to a new study released by State Street, a leading global provider of financial services to institutional investors.
The study is based on the newly launched State Street S&P Global Institutional Investor Carbon Indicator, a new tool created in collaboration with S&P Trucost, which tracks the global exposure of institutional investors’ portfolios to carbon emissions, using aggregated and anonymized information from the custody portfolios of State Street’s $37 trillion in assets under custody and management, and carbon emissions data provided by S&P Global Sustainable 1.
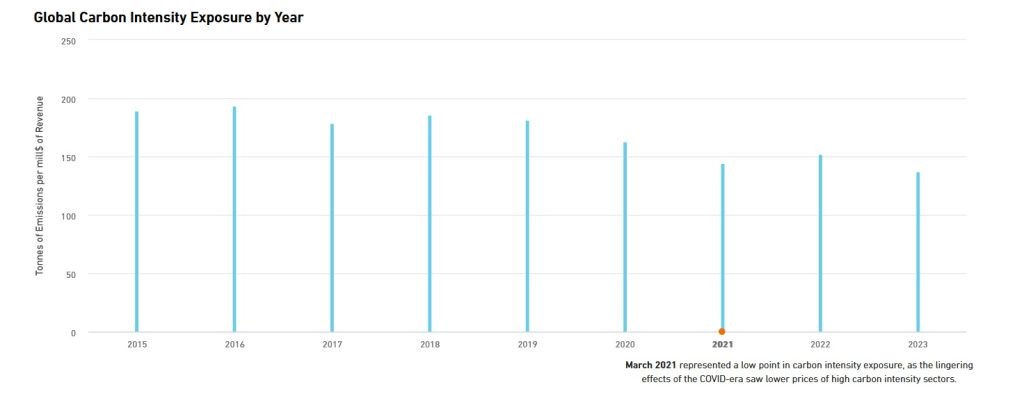
The new tool examines the portfolios’ emissions exposure, measured as tons of carbon emitted by portfolio companies and the weighting of those companies in the portfolios, as well as intensity exposure, or tons of carbon emitted per million dollars of revenue.
The report also provides information on the drivers of changes in these metrics, broken down by “flow effects,” or buying and selling decisions by portfolio managers, “company effects,” or changes in emissions at the company level, and “price effects,” or changes in company valuations that can affect weightings in portfolios.
You may also be interested in | Deloitte: “Less than half of practitioners have confidence in organizations’ ESG reporting capabilities”
More Facts
According to the State Street report, between March 2022 and March 2023, emissions exposure to large investors, such as mutual funds, pensions and sovereign wealth funds, grew significantly, up nearly 9% year-over-year to 4.3 million metric tons, as post-COVID economic activity and related emissions increased, and also as the relative valuations of carbon-intensive sectors, such as energy, rose.
However, while overall emissions increased, intensity measures declined, as income growth, particularly in carbon-intensive sectors, outpaced emissions growth.
By sector, the biggest drivers of these seemingly contradictory indicators were the carbon-intensive energy, materials and utilities sectors.
The energy sector had a particularly large impact on the carbon exposure of portfolios, due to a combination of higher valuations, which translated into higher portfolio weightings, and increased production, and emissions, with increased economic activity.
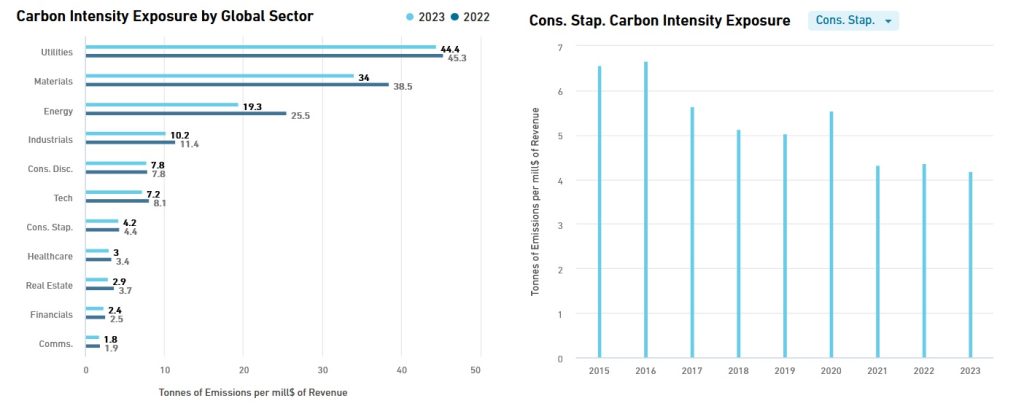
Similarly, materials and utilities companies also saw an increase in issuance over the past year, as did relative valuation. Despite the increase in emissions, each of these sectors recorded lower carbon intensity, with revenue growth outpacing emissions growth.
By “effect,” the report revealed that the biggest driver of increased portfolio carbon exposure was the price effect, as valuations increased in carbon-intensive sectors, followed by the company effect, as emissions grew with economic activity, while the impact of portfolio purchases and sales was relatively minor.
On the intensity front, the company effect drove almost all of the change, as energy sector revenues increased significantly more than sector emissions.
You can access the full State Street report by clicking here